 Skip to main content



Blog

How to
tell whether the problem is the chassis, the engine, or the driver: a guide based on real data
In professional motorsport, a difference of two or three
tenths can decide qualifying, a heat, or even
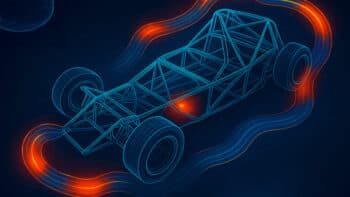
In professional motorsport, a difference of two or three tenths can decide qualifying, a heat, or even a championship. When the car is not performing as expected, everyone asks the same question:
Is the problem in the chassis, the engine, or the driver?
In this guide, we explain how to identify the source of a performance loss using real data and advanced metrics available through RaceData.
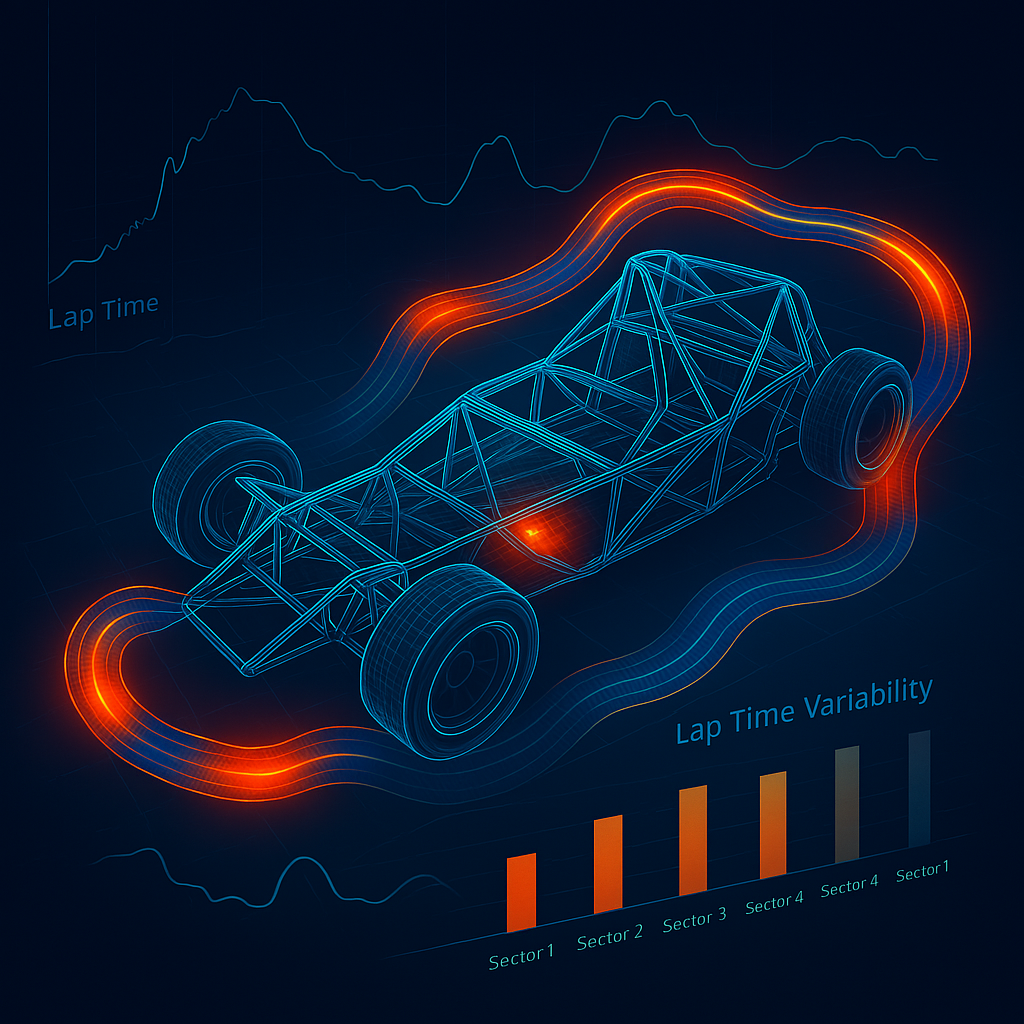
RaceData stores the setup sheet history from every session and every run.
1. Indicators of chassis-related problems
The chassis determines much of the car’s dynamic behavior: its ability to brake late, carry speed through corners, and put the power down efficiently. If the chassis is not properly balanced, the car becomes unpredictable and difficult to drive, particularly through cornering sections.
🔧 Most common symptoms:
- High variation in lap times through low- or medium-speed corners.
- Imbalance between corner entry, mid-corner, and exit behavior — understeer vs. oversteer.
- The driver loses time through corners despite remaining competitive on the straights.
- Lap-by-lap performance drop caused by tire overheating or degradation resulting from poor aerodynamic balance or suspension setup.
🔎 How RaceData helps detect it:
- Sector consistency analysis using standard deviation.
- Corner vs. straight-line comparison: if the driver is fast on the straights but loses time through corners, the chassis becomes a key area to investigate.
- Lap-time evolution compared with temperature or lap count, helping identify progressive performance loss caused by an inadequate setup.
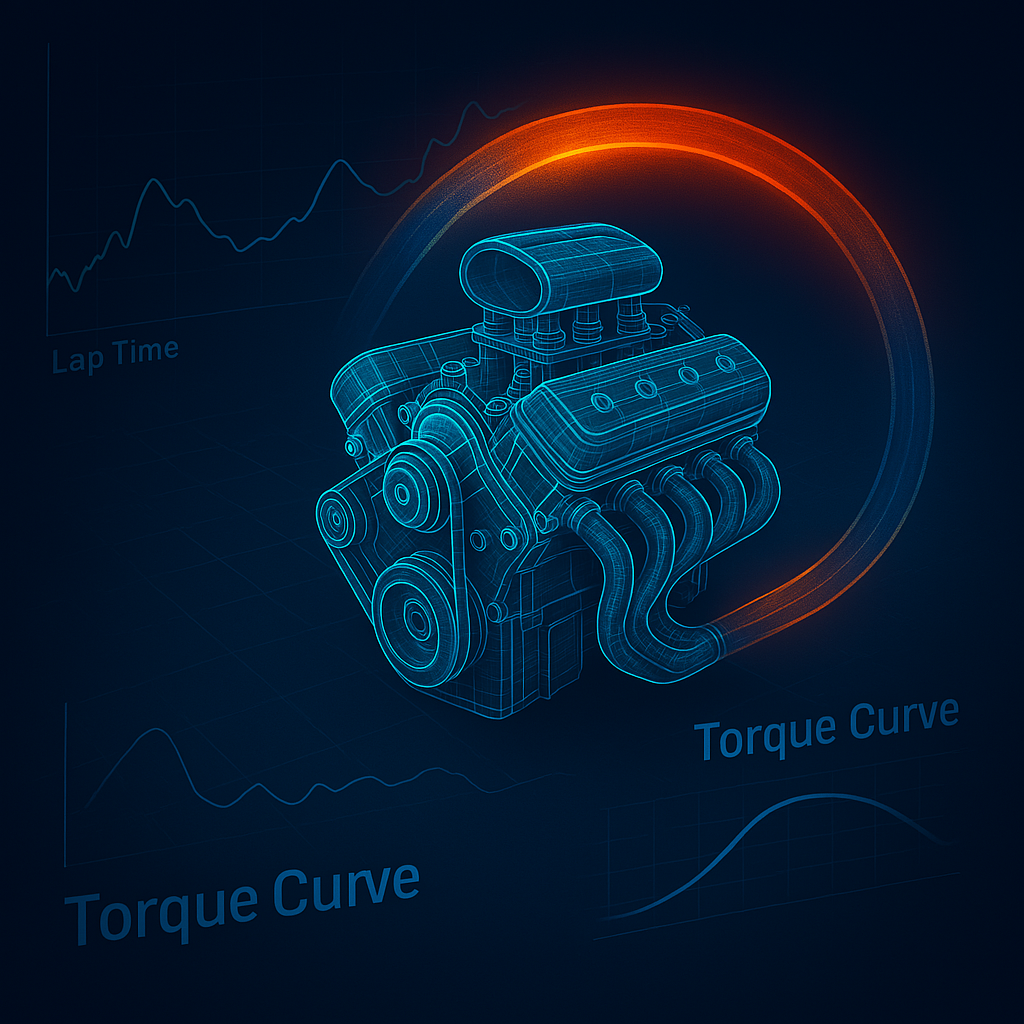
RaceData allows teams to record notes and engine-related variables linked directly to the session and run being analyzed. This makes it possible to maintain a clear history and understand the engine’s performance potential over time.
2. Indicators of engine-related problems
The engine directly affects acceleration, drive off the corners, and top speed. When power or torque delivery is compromised, the car may still perform well through corners but struggle to build speed on the straights or deliver a competitive overall lap time.
🔧 Most common symptoms:
- High-speed sectors consistently slower than the average.
- Difficulty keeping up with or overtaking other cars on the straights.
- Competitive pace through technical sections but an overall deficit in lap time.
- Unusual variations in RPM or acceleration times between sectors.
🔎 How RaceData helps detect it:
- Direct comparison of straight-line sectors between multiple cars running under similar conditions.
- Detection of insufficient acceleration from corner exit to the end of the following sector.
- Correlation analysis between RPM, average speed, and sector times.
- Integration with external telemetry or data acquisition sources to validate values such as fuel pressure or intake temperature.
In RaceData, the driver can record the car’s behavior after every run in a structured, parameterized way. Engineers can then analyze that information and cross-reference it with timing, weather, and track-condition data.
3. Indicators of driver-related errors
A driver may have the best possible car in terms of balance and power, but if the driving is not executed correctly, the lap time will not follow. Driving errors are often the hardest cause to acknowledge, but they are also among the most common.
🔧 Most common symptoms:
- A large difference between the ideal lap and the actual best lap, indicating execution errors.
- Inconsistent lap-time dispersion with no clear technical pattern.
- Repeated mistakes in the same sector or corner.
- Other drivers using the same setup achieve better lap times.
🔎 How RaceData helps detect it:
- Automatic ideal-lap calculation using the best sector times.
- Detection of repeated sector-level errors through heat maps or stability charts.
- Driver-to-driver comparisons using the same setup and similar conditions.
- Lap-by-lap dispersion histograms to evaluate driving consistency.
📊 Applied example: two drivers, same car
A team runs two drivers. Both use the same setup.
Driver A records an ideal lap of 1:27.150, but their best actual lap is 1:28.100.
Driver B records an ideal lap of 1:27.600 and an actual best lap of 1:27.700.
Analysis:
Driver B has a small margin of error and high repeatability: the car is working well, and the driver is consistent.
Driver A clearly has potential, but is unable to put the full lap together: the issue is therefore more likely to be related to driving execution.
RaceData provides these values in seconds, without the need for manual calculations.
✅ Conclusion: no more guesswork — make decisions with data
Identifying where the problem lies no longer has to depend entirely on technical instinct or an engineer’s intuition. With RaceData, you can determine whether the performance deficit is coming from the chassis, the engine, or the driver’s execution.
Make decisions with data and optimize the car from the very first practice session. Avoid incorrect diagnoses and spend your time working where it really matters.